

Curious about how to evaluate digital assets? Learn what is crypto market cap 2026, how it is calculated, why it matters more than token price, and how to spot common traps in this comprehensive beginner’s guide.
When you first step into the cryptocurrency market, it is easy to get blinded by individual token prices. You might look at Bitcoin trading at tens of thousands of dollars and think, “I missed the boat,” while looking at a meme coin priced at $\$0.00001$ and thinking, “If this hits just $\$1$, I will be a millionaire!”
Unfortunately, that is one of the most common traps for beginners. In the digital asset space, token price alone tells you almost nothing about a cryptocurrency‘s actual size, stability, or potential growth. To get the true picture, you need to understand financial scale.
So, what is crypto market cap 2026 and why does it remain the most critical metric for evaluating digital assets? In this foundational guide, we will break down the mechanics of market capitalization, compare it to traditional finance, explore the different risk tiers, and reveal how to use this metric to make smarter, data-driven investing decisions.
1. What Is Crypto Market Cap? The Golden Formula
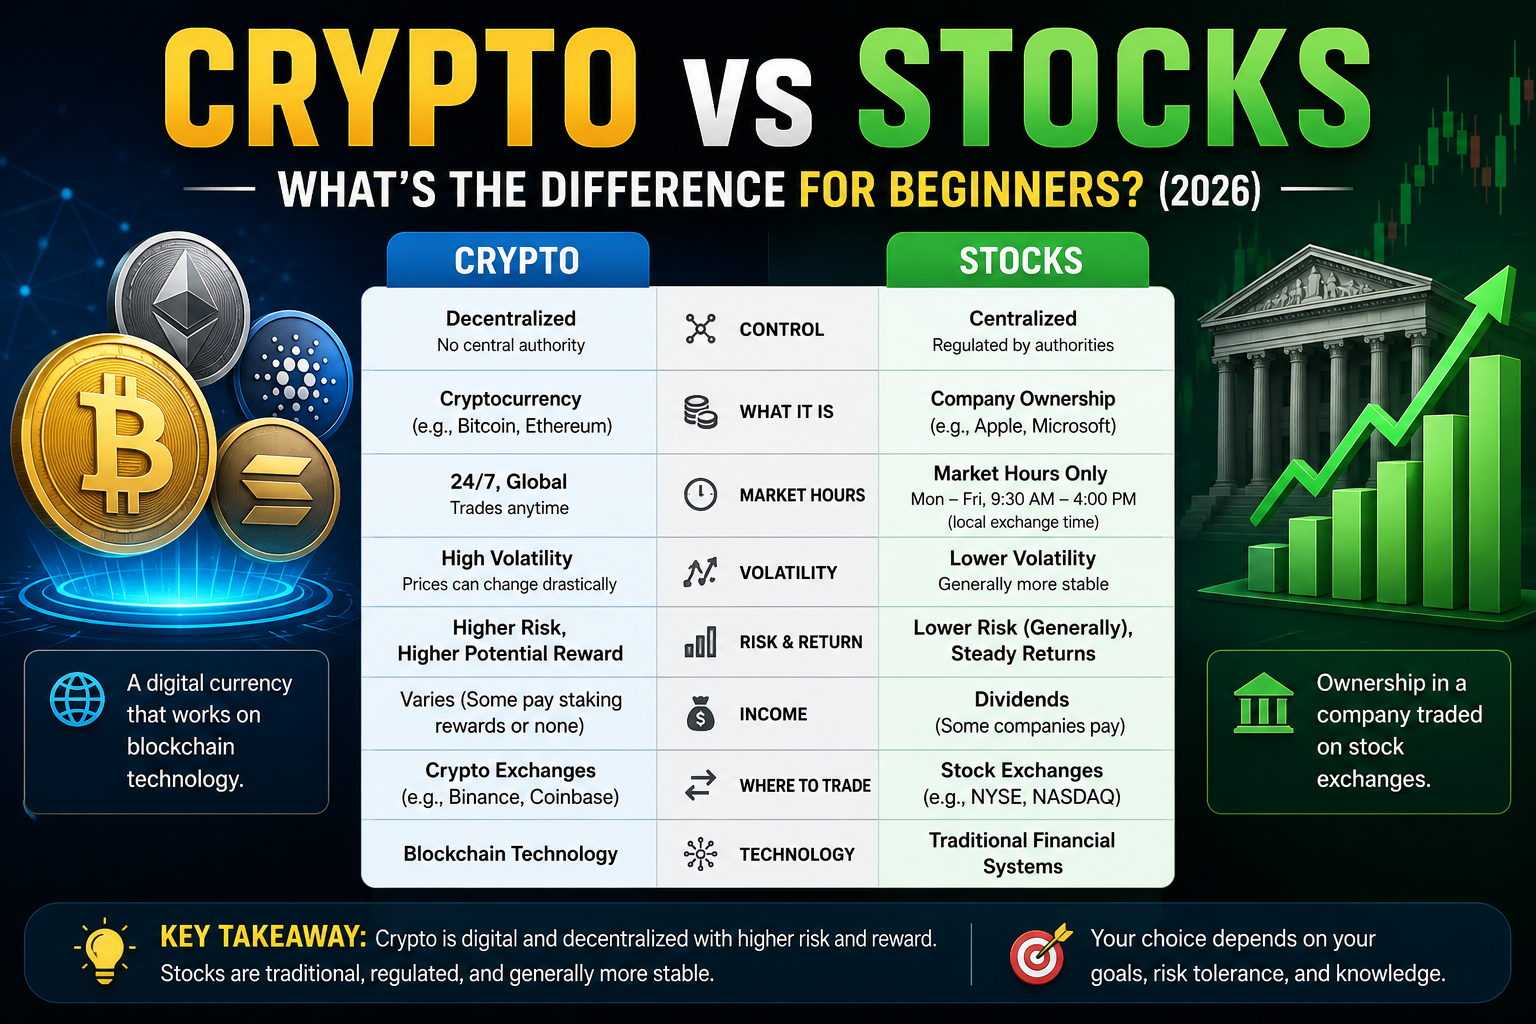
To truly grasp what is crypto market cap 2026, it helps to look at how traditional stock markets measure the financial scale of mega-corporations like Apple, Microsoft, or Tesla. In the corporate world, market capitalization represents the total dollar value of a company’s outstanding shares. If an investor wants to know how much a legacy company is worth on the open market, they don’t just look at the stock price; they look at the total market cap.
In the blockchain ecosystem, the core concept remains exactly the same, but instead of counting corporate shares, we look at public tokens or coins. Whenever you are analyzing a new digital asset asset class, asking yourself what is crypto market cap 2026 structure for that token is the very first step to establishing its true baseline value.
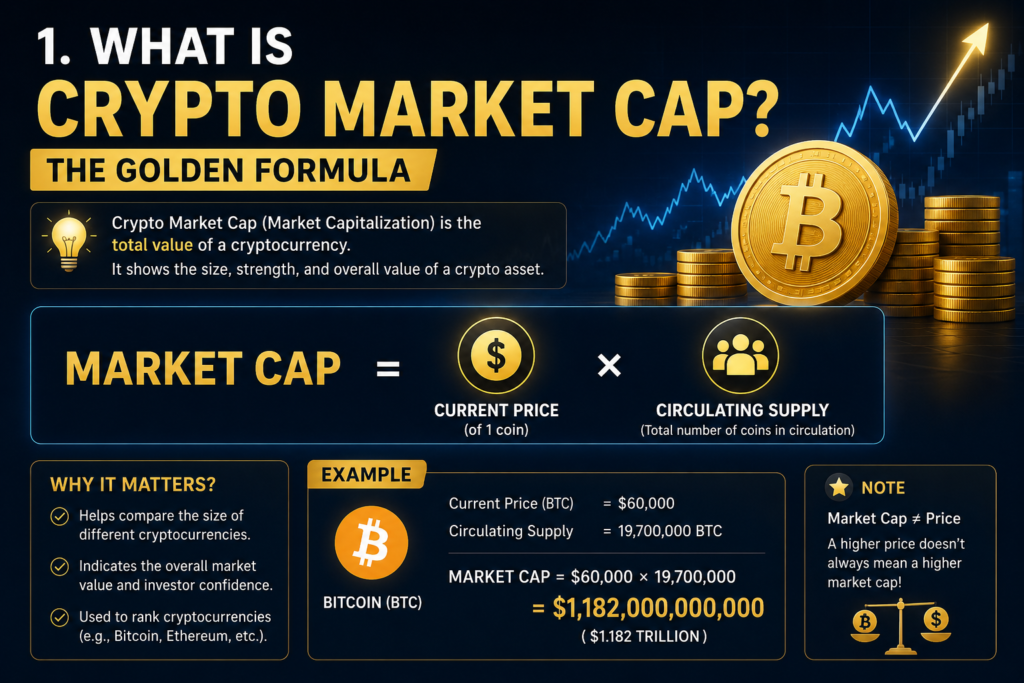
The Market Cap Formula
The mathematical calculation for determining market capitalization is incredibly straightforward and objective. It relies entirely on two real-time, fluid variables that update second by second across global order books:
-
Current Price: The real-time fiat market value (usually denominated in USD) of a single unit of a cryptocurrency. This price is determined by active global supply and demand dynamics across hundreds of centralized and decentralized trading exchanges.
-
Circulating Supply: The exact number of coins or tokens that have already been generated, minted, unlocked, and are actively circulating in the public marketplace. This excludes tokens that are locked in team escrow, burned, or frozen in long-term smart contracts.
Real-World Example Comparison
To visualize how this works, let’s look at a traditional business alongside a digital asset. Imagine Company A has 1 million shares outstanding, and each individual share is worth $\$100$. Its total market cap is calculated as:
Now, let’s apply this exact line of thinking to the blockchain space to see what is crypto market cap 2026 logic in action. Look at a premiere cryptocurrency like Bitcoin. If Bitcoin is trading at a current price of $\$70,000$ and its circulating supply is roughly 19.7 million coins, its market capitalization sits at approximately:
This massive number tells you the aggregate market value of the entire Bitcoin network. It proves that trying to understand a project by looking only at the individual token price is completely meaningless without factoring in the accompanying circulating supply.
Circulating Supply vs. Fully Diluted Valuation (FDV)
When researching what is crypto market cap 2026 data points on top-tier tracking platforms, you will quickly notice that analytics sites display two very distinct metrics side-by-side: Circulating Market Cap and Fully Diluted Valuation (FDV).
Differentiating between these two metrics is absolutely vital for developing a sustainable, long-term web3 investment strategy, as they reveal completely different realities about a project’s financial future.
-
Circulating Market Cap provides a snapshot of the current economic reality. It only counts the liquid tokens available for the public to trade, buy, and sell right now in the open market.
-
Fully Diluted Valuation (FDV) is a predictive metric. It calculates what the total market cap would be if the absolute maximum supply of the token were already unlocked, minted, and actively flowing through the ecosystem.
The formula for calculating FDV skips current supply and looks directly at the ultimate hard cap of the project:
The Token Dilution Trap
Why does this matter when answering what is crypto market cap 2026 for a specific protocol? If a brand-new DeFi or AI crypto project launches with a low circulating supply but a massive maximum supply locked up behind the scenes, you face an invisible risk. Those locked tokens are typically earmarked for future team allocations, ecosystem staking rewards, or private venture capitalist (VC) distributions.
When those locked tokens hit their scheduled release dates and enter the public circulating supply, they create massive, structural sell pressure. If public demand for the token does not grow at the exact same exponential rate as the incoming supply inflation, the individual price of your tokens will aggressively drop, diluting the value of your personal holdings even if the total project value remains completely stagnant on paper.
Therefore, whenever you ask what is crypto market cap 2026 for a asset you like, always check the ratio between its current circulating supply and its FDV to ensure you aren’t walking straight into an aggressive token dilution trap.
2. Why Market Cap Matters Far More Than Token Price
Many newcomers entering the digital asset ecosystem make the dangerous mistake of choosing their investments based purely on an individual token’s price. They automatically assume that “cheap” coins costing fractions of a cent have substantially more room to grow than “expensive” coins trading in the hundreds or thousands of dollars.
However, a single token’s unit price is completely arbitrary and financially meaningless without knowing exactly how many tokens exist in public hands. This exact psychological bias is why mastering the concept of what is crypto market cap 2026 serves as your ultimate defense against common marketing traps and illusions in the web3 space.
The $\$1$ Psychology Trap Revealed
Let’s look at a concrete, detailed example to fully understand why focusing on nominal unit price is an absolute illusion, and why looking at what is crypto market cap 2026 data changes your entire perspective:
-
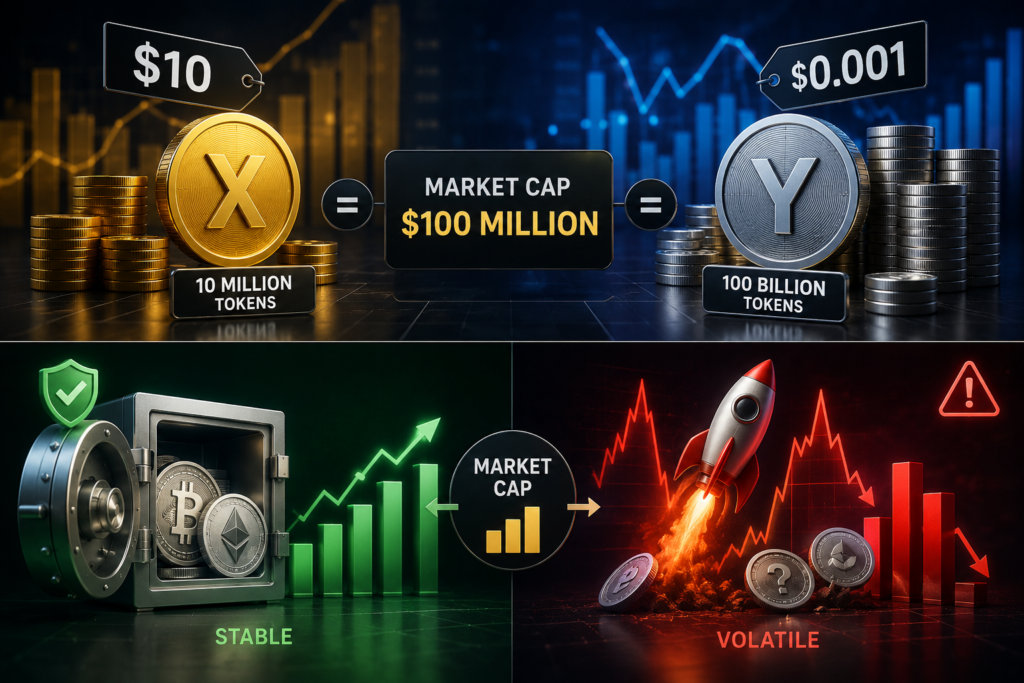
Asset X: This token is priced at a seemingly expensive $\$10$ per unit, but it has a small circulating supply of only 10 million tokens. By multiplying these numbers, we find its total market cap sits at $\$100 \text{ million}$.
-
Asset Y: This token is priced at a seemingly incredibly cheap $\$0.001$ per unit, but it features a massive circulating supply of 100 billion tokens. When we run the formula, its total market cap also sits at exactly $\$100 \text{ million}$.
Financially speaking, both of these web3 projects are exactly the same size, carry similar systemic weight, and require the exact same amount of new capital inflow to grow.
[Asset X] Price: $10    | Supply: 10M   | Market Cap: $100M
[Asset Y] Price: $0.001 | Supply: 100B  | Market Cap: $100M
Now, let’s look at the growth expectations. For Asset X to double in price to $\$20$, its market cap simply needs to grow from $\$100 \text{ million}$ to $\$200 \text{ million}$—a highly realistic milestone for a growing protocol.
Conversely, consider the retail dream of Asset Y reaching just $\$1$ per token. For Asset Y to hit $\$1$, its market capitalization would have to balloon from $\$100 \text{ million}$ to an astronomical $\$100 \text{ billion}$!
For context, Asset Y hitting $\$1$ would require it to become larger than major multi-national corporations and top-tier layer-1 legacy blockchains. When you train yourself to look at what is crypto market cap 2026 frameworks instead of unit prices, you instantly realize that Asset Y is not “cheaper” or more likely to give you exponential returns than Asset X. In fact, its massive supply makes major upward price movements mathematically harder, not easier.
Determining True Growth Potential and Liquidity
Beyond debunking price illusions, analyzing what is crypto market cap 2026 structures acts as a vital tool for assessing a token’s actual liquidity depth and price stability. Market capitalization functions as a ceiling of financial reality; it outlines precisely how much fiat currency or stablecoin volume must flow into an asset’s order book to move its market price significantly.
High Market Cap = Low Volatility, Stable Foundation
When a digital asset achieves a massive valuation, it gains structural inertia. For example, it takes hundreds of millions, sometimes billions of dollars of concentrated buying or selling volume to move the price of Bitcoin or Ethereum by even $5\%$ in a single day. This depth of liquidity makes large-cap assets much safer havens during macro market downturns, preserving your capital when market panic sets in.
Low Market Cap = High Volatility, Extreme Risk
On the other end of the spectrum, an early-stage micro-project with a small market cap of only $\$5 \text{ million}$ requires very little capital to experience wild price swings. If a few wealthy investors (commonly known as “whales”) inject just a few hundred thousand dollars into the liquidity pool, the token price can easily triple overnight.
However, this door swings both ways. If those same whales decide to take profits and liquidate their positions, the entire market cap can crash by $90\%$ in a matter of minutes. By anchoring your research in what is crypto market cap 2026 metrics, you can accurately gauge these volatility profiles and align your token selections with your personal risk tolerance.
3. Large Cap, Mid Cap, and Small Cap Crypto Tiers
Just like traditional equities, digital assets are classified into categories based on their total valuation. When evaluating what is crypto market cap 2026 dynamics, classifying tokens into risk tiers helps you build a diversified portfolio that aligns with your financial goals.
| Category | Market Cap Range | Risk Profile | Primary Characteristics | Examples |
| Large-Cap | Above $\$10 \text{ billion}$ | Lower Risk / Lower Rewards | Industry leaders, high liquidity, institutional adoption, resilient in bear markets. | Bitcoin (BTC), Ethereum (ETH) |
| Mid-Cap | $\$1 \text{ billion}$ to $\$10 \text{ billion}$ | Moderate Risk / Moderate Rewards | Established protocols, scaling infrastructure, significant ecosystem growth potential. | Top Layer-1s, Major DeFi Protocols |
| Small-Cap | Below $\$1 \text{ billion}$ | Extreme Risk / High Exponential Rewards | Early-stage projects, niche use cases, highly volatile, prone to extreme speculation. | Emerging Web3 apps, niche AI tokens, Meme coins |
The Risk and Opportunity Trade-off
Choosing where to allocate your funds depends entirely on your risk tolerance.
-
Large-Caps act as the conservative foundation of a crypto portfolio. While they are unlikely to give you $100\times$ returns from current levels, they offer relative stability and act as a reliable store of value over multi-year cycles.
-
Mid-Caps represent projects that have proven their product-market fit but are still expanding their user base. They offer a balanced mix of growth potential and survival probability.
-
Small-Caps (and Micro-Caps) are highly speculative venture-capital style plays. The vast majority of small-cap tokens eventually fail or lose their liquidity. However, picking the right small-cap early on can yield life-changing returns.
4. The Macro View: Total Crypto Market Cap and Bitcoin Dominance in 2026
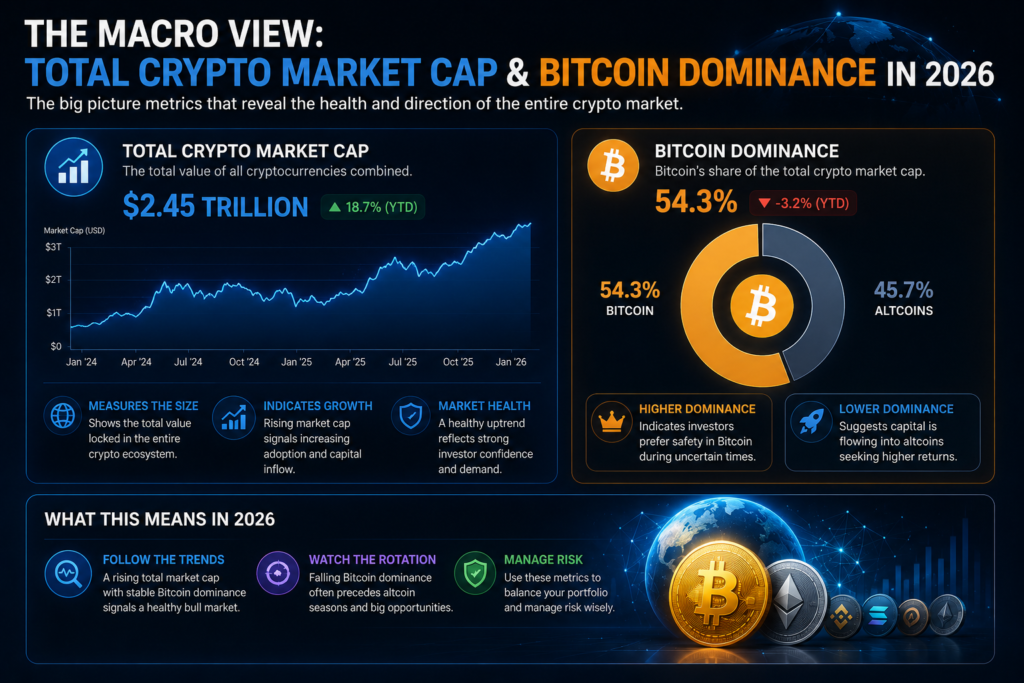
To truly answer what is crypto market cap 2026, we must step back from looking at individual digital assets in isolation and analyze the macro indicators that shape the entire Web3 economic landscape. Evaluating a single token without understanding the broader market context is like analyzing a single house without looking at the local real estate market conditions. In the global digital asset industry, the two most vital health metrics you must track are the Total Crypto Market Capitalization and Bitcoin Dominance (BTC.D).
Total Crypto Market Cap 2026: The Big Picture
The Total Crypto Market Cap represents the combined sum of the individual market caps of every single tracked digital asset in existence. This includes industry giants like Bitcoin and Ethereum, as well as thousands of altcoins, layer-2 tokens, niche utility assets, and fiat-pegged stablecoins. This aggregate figure acts as a direct barometer for the total amount of value moving through the global decentralized economy, and it can be tracked in real-time on major data aggregators.
As of mid-2026, the total cryptocurrency market cap hovers steadily around the $\$2.5 \text{ trillion}$ to $\$2.8 \text{ trillion}$ range. This massive macro figure continuously fluctuates based on heavy institutional capital inflows via spot ETFs, global macroeconomic shifts, corporate treasury strategies, and evolving regulatory clarity across key global financial jurisdictions.
+-------------------------------------------------------------+
|               TOTAL CRYPTO MARKET CAP (2026)                |
|                     ~$2.5T - $2.8T                          |
+------------------------------+------------------------------+
|       Bitcoin Market Cap     |      Altcoins + Stablecoins  |
|         (BTC Dominance)      |          Market Cap          |
+------------------------------+------------------------------+
Consistently monitoring this collective metric is foundational to understanding what is crypto market cap 2026 macro momentum. It helps sharp investors instantly identify whether the broader web3 space is moving through a quiet institutional accumulation phase, an aggressive retail-driven bull run, or a risk-averse, capital-preservation bear cycle.
Bitcoin Dominance (BTC.D): The Market’s Ultimate Compass
You cannot fully master what is crypto market cap 2026 structures without keeping a constant eye on Bitcoin Dominance (commonly abbreviated as BTC.D). Bitcoin Dominance is a percentage metric that measures Bitcoin’s specific market capitalization relative to the total overarching cryptocurrency market cap.
The mathematical formula to track this dynamic relationship is:
Historically, and continuing throughout 2026, tracking Bitcoin Dominance serves as the most reliable strategic compass for navigating market rotation cycles. It directly illustrates how liquidity flows between lower-risk and higher-risk digital assets:
-
High or Rising Bitcoin Dominance (e.g., $50\% – 55\%$+): This trend reveals that capital is actively fleeing highly volatile, risky altcoins and taking shelter in the relative safety, liquidity, and regulatory maturity of Bitcoin. This flight to quality typically occurs during the early stages of a fresh market expansion or during severe, unexpected market crashes.
-
Falling Bitcoin Dominance (e.g., Dropping Below $45\%$): This trend signals that investors have gained massive market confidence. They are moving their capital out of Bitcoin and aggressively rotating profits into higher-risk, exponentially higher-reward mid-cap and small-cap altcoins. This specific phenomenon triggers what traders enthusiastically call a full-scale “Altseason.”
Deepening your knowledge of what is crypto market cap 2026 macroeconomic structures means keeping BTC.D at the center of your charting dashboard. It acts as an invaluable guide, telling you exactly whether you should be preserving your wealth in safe-haven foundational assets like Bitcoin, or strategically riding the wave of high-momentum altcoin speculation.
5. Can Crypto Market Cap Be Manipulated?
A major point of confusion for beginners exploring what is crypto market cap 2026 properties is the assumption that a project’s market capitalization represents the exact, actual amount of cash that has been injected into that specific ecosystem. This is a highly dangerous financial misconception.
It is vital to understand that market cap does not equal realized cash inflow, nor does it represent a pool of hard currency sitting in a project’s reserve vault. Because of how the fundamental formula is structured, market capitalization can easily be artificially inflated, warped, or outright manipulated by bad actors—especially within illiquid, small-cap, or newly launched markets.
The Illiquidity Trick (Low Float Manipulation)
To see how easy it is to distort a token’s perceived value on paper, let’s break down a classic tactic known in the industry as the illiquidity or low-float trick. This scenario plays out daily across various decentralized networks:
-
Step 1: A malicious developer mints a brand-new meme token with a massive total supply of 1 billion units.
-
Step 2: Instead of distributing these tokens evenly to the public, the developer keeps 999 million of those tokens locked away in their private wallet.
-
Step 3: The developer deposits only the tiny remaining fraction—1 million tokens—into a liquidity pool on a decentralized exchange (DEX).
-
Step 4: The developer’s accomplice or a secondary private wallet executes a single trade, buying just one token for a price of $\$5$.
Because global tracking platforms rely on the latest spot trade to determine an asset’s price, the automated market cap formula instantly triggers a massive, artificial valuation jump based purely on that single transaction:
On paper and across automated ranking dashboards, this project suddenly looks like a highly successful, top-tier corporate asset, seemingly rivaling established legacy companies or mid-cap infrastructure networks.
[On Paper Dashboard] -------------------> $5 Billion Market Cap (Top Tier)
[Actual Real Liquidity Pool] -----------> $5 of Hard Cash Assets
In reality, the actual cash liquidity supporting this entire multi-billion-dollar valuation is exactly five dollars. If any normal retail investor falls for the illusion, buys tokens, and later attempts to cash out even a modest amount of their holdings, they will find no depth in the order book. The moment anyone tries to sell a significant amount of tokens, the price will instantly plummet toward zero, exposing the hollow nature of the inflated valuation.
Understanding what is crypto market cap 2026 vulnerabilities means realizing that an asset’s market cap is only as real as the underlying liquidity backing its order books.
Wash Trading and Order Book Manipulation
Another prevalent method used to distort valuations involves automated trading bots operating on minor, unregulated, or low-tier centralized exchanges. This practice is known as wash trading.
During a wash trading scheme, a project team or a coordinated group of market manipulators sets up high-frequency trading bots that continuously buy and sell the exact same pool of tokens back and forth to each other. Because these trades are happening between accounts owned by the same entity, no actual asset ownership changes hands, and no real capital is leaving the circle.
However, this constant artificial trading activity generates two highly deceptive signals:
-
It creates massive, fake daily trading volume, making the asset look highly liquid and actively traded.
-
The bots gradually tick the purchase price upward with each internal trade, which automatically pumps the calculated market cap.
Unsuspecting retail investors scanning token aggregators often sort by “Top Gainers” or rising valuations. They see a project with an aggressively growing market cap, assume it must be a thriving, highly demanded network, and FOMO (Fear Of Missing Out) into the asset with real money.
Once enough organic retail liquidity fills the exchange’s order books, the manipulators abruptly shut off their trading bots and execute a massive market dump, selling their heavily inflated, low-cost supply to the new buyers. The market cap collapses within hours, leaving retail traders holding illiquid, worthless tokens.
By grounding your investment framework in a deeper knowledge of what is crypto market cap 2026 limitations, you can look beyond surface-level numbers, check the actual depth of the market order books, and avoid falling victim to these highly coordinated liquidity traps.
6. Common Mistakes Beginners Make When Analyzing Market Cap
Now that you have a firm grasp of what is crypto market cap 2026 fundamentals, let’s look at the most common analytical errors investors make so you can actively avoid them.
Mistake 1: Ignoring the Token Release Schedule (Vesting)
A project might look attractive with a low circulating market cap of $\$50 \text{ million}$. However, if its FDV is $\$1 \text{ billion}$ and $50\%$ of the total supply is scheduled to be unlocked and distributed to early investors next month, the incoming supply shock could decimate the price. Always cross-reference current market cap with the project’s tokenomics and vesting schedule.
Mistake 2: Comparing Unrelated Categories
Comparing the market cap of a decentralized finance (DeFi) oracle to a layer-1 blockchain or a privacy token is like comparing an automotive parts manufacturer to an oil conglomerate.
When evaluating whether a market cap is “high” or “low,” only compare assets within the same sector. Look at how a layer-1 asset compares to Ethereum or Solana, or how a gaming token compares to top Web3 gaming ecosystems.
Mistake 3: Believing Market Cap is a Hard Ceiling
While market cap keeps expectations grounded, it isn’t an unbreachable wall. Some skeptics once claimed Bitcoin could never reach a $\$1 \text{ trillion}$ market cap because it would outsize traditional banks. Today, Bitcoin regularly competes with the world’s most valuable assets. As institutional adoption grows and global inflation devalues fiat currencies, the overall ceiling for digital asset valuations continues to rise.
7. Frequently Asked Questions (FAQ)
7. Frequently Asked Questions (FAQ)
Q1: Does a high market cap mean a crypto asset is completely safe to buy?
No, a high market cap never guarantees absolute investment safety. While a multi-billion-dollar valuation indicates structural stability, deeper order book liquidity, and historical resilience across multiple market cycles, it does not make the asset immune to catastrophic risks.
Even the most dominant digital assets regularly experience staggering drawdowns of $50\%$ to $80\%$ during macroeconomic bear markets or sudden global liquidity squeezes. Furthermore, systemic vulnerabilities can always emerge. A project with a massive market cap can still fail entirely due to fatal smart contract exploits, sudden regulatory crackdowns by global authorities, or internal governance collapses.
To safely navigate these risks, it is vital to complement your evaluation of what is crypto market cap 2026 data with a robust understanding of structural market cycles. Learning how to read a crypto chart will help you time your entries and exits around these major valuation shifts rather than buying blindly at the absolute top of a cycle.
Q2: Where can I find reliable, real-time data on what is crypto market cap 2026?
The most trustworthy and universally utilized data aggregators for tracking global crypto market capitalizations, live trading volumes, circulating supplies, and historical charts.
These foundational tracking platforms compile raw transactional data from hundreds of centralized and decentralized exchanges worldwide to calculate a highly accurate, weighted global spot price for thousands of digital assets.
When you are researching what is crypto market cap 2026 metrics, checking these platforms daily allows you to monitor structural macro shifts, track individual asset rankings, and evaluate whether a specific token’s circulating supply matches its publicly advertised tokenomics schedule.
Q3: How does burnt supply affect a project’s market cap?
When a blockchain network or development team executes a token “burn” (permanently destroying tokens by sending them to an un-spendable, verifiable burn address), the project’s active circulating supply decreases.
It is a common beginner misconception that a token burn instantly increases or spikes a project’s market capitalization. According to the core financial formula:
If a burn occurs but the overarching market demand and token unit price remain completely unchanged, the mathematical market cap actually stays exactly the same. However, a reduction in the circulating supply denominator fundamentally alters the scarcity dynamics of the asset. Over time, if buying demand remains steady or increases against this newly restricted, scarcer supply, it can create organic upward pressure on the individual token price—which will subsequently drive up the project’s aggregate market cap.
Q4: Why do some coins have an infinite maximum supply?
Certain major cryptocurrencies operate without a hard-coded maximum supply limit to ensure the long-term economic sustainability of their underlying networks. Blockchains like Ethereum and Dogecoin utilize dynamic, programmatic issuance models that continuously mint a predictable number of new tokens over time.
These newly minted tokens serve a vital structural purpose: they are paid out as economic incentives to network miners or validators who spend computational power or stake capital to secure the decentralized ledger.
For assets with infinite supplies, simply looking at historical price targets is an unreliable approach. Instead, your research into what is crypto market cap 2026 trends must focus heavily on the project’s net annual inflation or deflation rate. On networks like Ethereum, programmatic burning mechanisms (such as EIP-1559) can actually burn more transaction fees than the network mints, rendering an asset with an infinite maximum supply fundamentally deflationary over periods of high network utility.
Q5: How should a absolute beginner start evaluating these metrics?
If you are completely new to the space and trying to contextualize what is crypto market cap 2026 scaling laws, the best path forward is to start with the foundational assets that established these economic frameworks.
Before diving into high-risk, volatile small-cap assets or complex decentralized finance protocols, you should take the time to master the core properties of the industry’s two pillars. Begin by exploring the ultimate basics through our comprehensive guides on what is cryptocurrency 2026 and what is bitcoin 2026. Building a firm educational foundation on these core large-cap assets will give you the baseline clarity needed to spot overvalued traps, identify genuine network utility, and accurately calculate risk across the entire web3 economic landscape.
Conclusion: Making Smarter Moves with Market Cap Data
Mastering the concept of what is crypto market cap 2026 is one of the most vital milestones in your journey to becoming a profitable, rational web3 participant. It strips away the psychological illusion of “cheap” or “expensive” unit prices and forces you to evaluate assets based on their true economic scale, liquidity depth, and structural risk profile.
As you look to expand your knowledge of market fundamentals, remember to look beyond the surface numbers. Combine your market cap analysis with an evaluation of a project’s underlying technology, token utility, and historical chart patterns to build an all-encompassing investment framework.
Disclaimer: The information provided in this article is for educational and informational purposes only. It should not be construed as financial, legal, or investment advice. Cryptocurrencies are highly volatile and speculative assets. You should always conduct your own thorough research, assess your financial situation, and consult with a certified financial advisor before making any investment decisions.